Rome Weather Analysis Project
Nov 19, 2024
·
2 min read
📊 Comprehensive Climate Study (1950-2022)
A detailed analysis of Rome’s changing climate using advanced data analysis and machine learning techniques. This project offers insights into temperature trends, precipitation patterns, and climate change indicators using historical weather data.
🌡️ Key Metrics
- Time Range: 72 Years (1950 - 2022)
- Data Points: 26,280 Daily Weather Records
- Temperature Range: -1.1°C to 34.4°C (Historical)
📈 Analysis and Findings
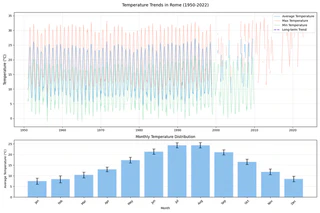
Temperature Trends (1950-2022)
- Clear seasonal temperature cycles identified
- Long-term warming trend evident in the data
- Peak temperatures observed in July-August
- Significant variations between seasons
Precipitation Patterns
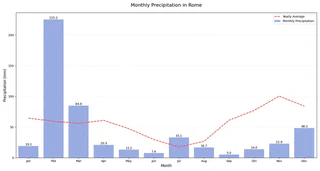
- Highest rainfall in February (~225mm)
- Driest month is September (~5mm)
- Clear seasonal precipitation pattern
- Significant year-to-year variability
Variable Correlations
- Strong positive correlation (0.99) between average and maximum temperatures
- Strong positive correlation (0.98) between average and minimum temperatures
- Weak negative correlation (-0.35) between precipitation and temperature variables
Machine Learning Models and Comprehensive Analysis
🔬 Technical Details
Analysis Techniques
- Time series analysis
- Seasonal decomposition
- Statistical testing (Mann-Kendall, Shapiro-Wilk)
- Machine learning models
- Data visualization using matplotlib, seaborn
Model Performance
| Model | R-squared (R²) |
|---|---|
| Linear Regression | 0.884 |
| Ridge Regression | 0.884 |
| Lasso Regression | 0.838 |
| Random Forest | 0.918 |
📊 Data Source
The analysis uses the ‘Roma_weather.csv’ dataset, containing daily weather records from 1950 to 2022, including:
- Average temperature (TAVG)
- Maximum temperature (TMAX)
- Minimum temperature (TMIN)
- Precipitation (PRCP)
🛠️ Technologies Used
- Python
- Pandas, NumPy
- Matplotlib, Seaborn
- Scikit-learn
- Jupyter Notebooks

Authors
Independent Researcher & Geospatial Data Scientist
A Geospatial Data Scientist combining remote sensing, machine learning, and agricultural domain knowledge to address challenges in food security and environmental monitoring. Published peer-reviewed research achieving 93.3% accuracy in rice paddy mapping across 732,345 hectares in Telangana, India.